Tagged: Excel
- This topic has 0 replies, 1 voice, and was last updated 4 years, 6 months ago by
Tom Howard.
-
AuthorPosts
-
10th July 2020 at 11:32 #73354
Tom Howard
KeymasterTwenty years ago, we all pored over Erlang tables printed in traffic engineering textbooks when designing voice networks. Things have moved on, and we now use electronic tools such as Erlang for Excel.
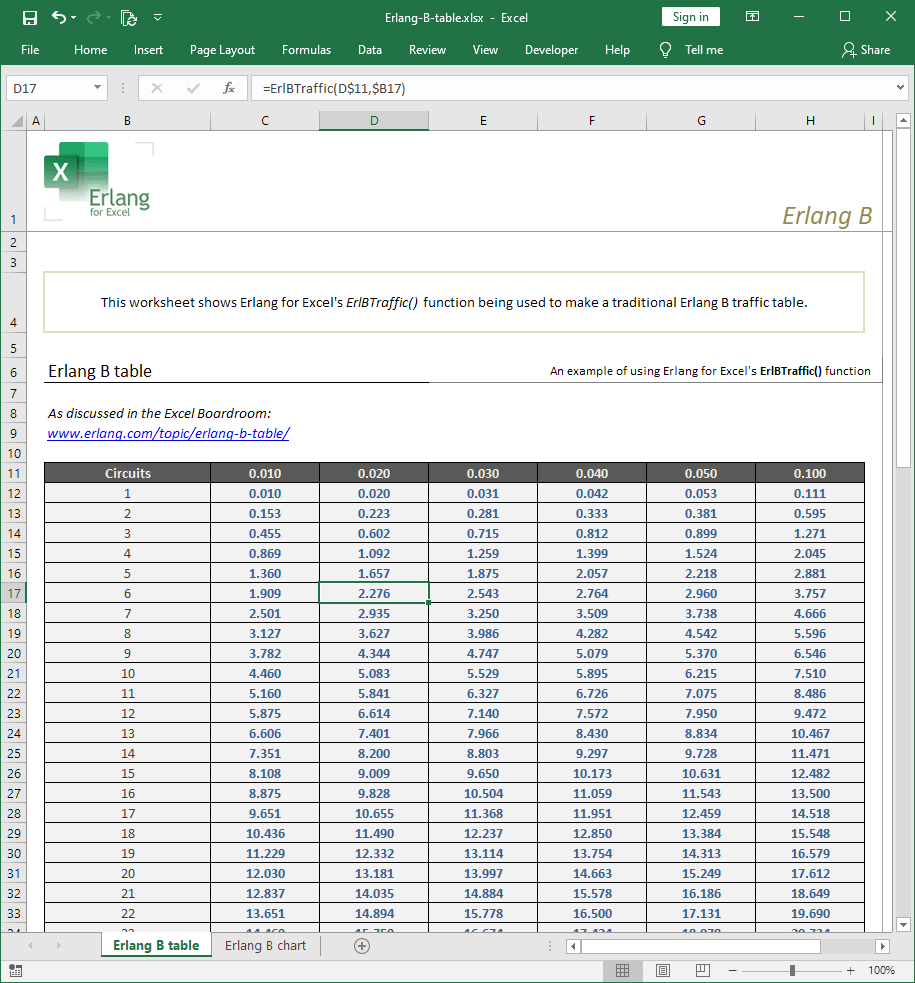
But sometimes it can be useful to take a step back and take a wider view of the techniques in our toolbox. With this in mind, I created a workbook that emulates the traffic tables of the last century. I’m not suggesting we return to the manual ways of traffic engineering, but it helped remind me of the basic principles of traffic engineering.

Each row of the table I drew represents an increasing number of circuits in a trunk group (I went from 1 to 30, but you could go up to tens of thousands of lines). The number of circuits are shown in column B, each row incrementing by one. The columns to its right show the calculated traffic in Erlangs that can be offered to a trunk group of that size, keeping the blocking within the values in the column headings (0.01 means 1% blocking; 0.02 means 2% blocking etc.).
In columns C to H, I used the ErlBTraffic() function installed by Erlang for Excel. It takes two arguments: Blocking and Lines. For Blocking, I entered an absolute cell reference to the column heading in row 11. For Lines, I made an absolute reference to column B in each cell’s row.
There were no great surprises. Less circuits are required as you relax your blocking target. For example, at P=0.01 (1% blocking), a trunk group offered 13.5 Erlangs busy hour traffic needs 22 circuits; at P=0.10 (10% blocking), it needs only 16 circuits. This reminded me of the compromises we used to make while balancing performance against transmission costs. Priorities have changed: with bandwidth (and therefore voice circuits) so cheap, why wouldn’t you aim for a high service level?
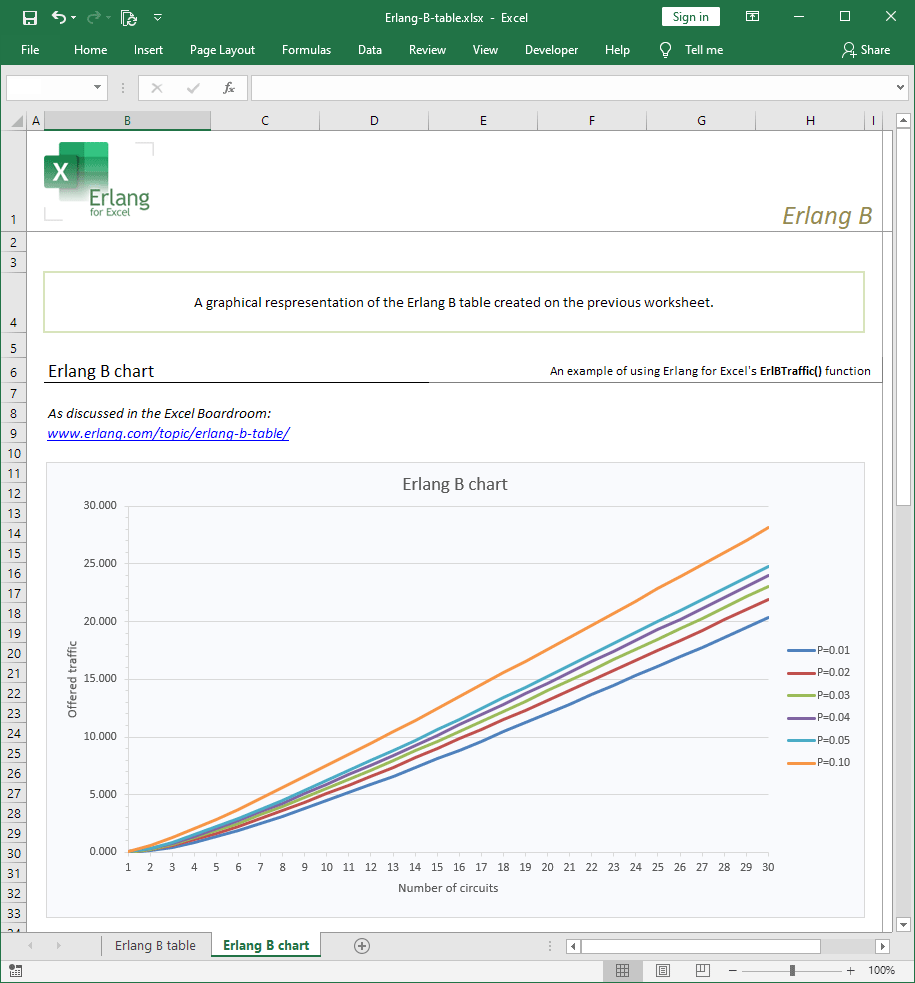
Nostalgia over, I decided to plot the results on an Excel chart.

I used Excel’s charting feature to plot the data from the Erlang B table I’d previously created using Erlang for Excel. Each line (“series”) plots a different probability of blocking, with the number of circuits on the x-axis and offered busy hour traffic on the y-axis, in Erlangs.
I was surprised to see the lines so flat. I had imagined that the ratio of offered traffic and required circuits would constantly change as the system benefited from economies of scale. Certainly, that was the case below 5 Erlangs, but the ratio soon settled at between 60% and 70%.
While not a real design exercise, this experiment has reminded me how useful it can be to visualise data, and Excel makes that easy. You’re welcome to use this workbook and share your thoughts.
You can download this workbook (Erlang-B-table.xlsx)
You will need Erlang for Excel installed in order for the =ErlBTraffic() formula to work. -
AuthorPosts
- The forum ‘Excel Boardroom’ is closed to new topics and replies.


